Reports allow you to view analytics by active users (blocked ones are not included in it) by parameters:
User activity;
Average score on the program test;
Progress on the training program;
Event statistics.
Untested tasks.
Training programs.
Latest materials.
Training programs that require attention
Scoring by Users.
Scoring by materials.
These widgets can be swapped. To do this, click on "Change the order of widgets" in the upper right corner.
Next, select the widget with the mouse and drag. After - be sure to save the changes.
Let's analyze these concepts in more detail.
1. User activity.
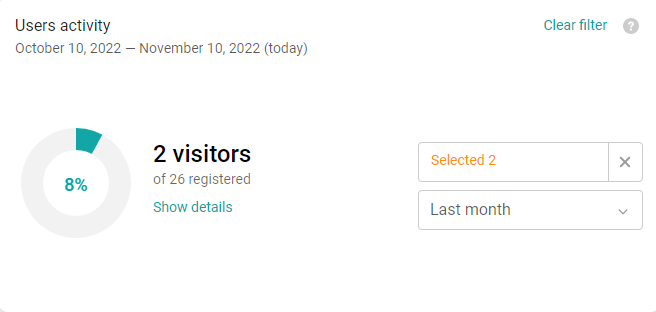
The widget displays the percentage of users who visited the platform for the selected period to all registered on the platform.
It is possible to select groups of employees in the filters and set a period (week, month, quarter, all the time).
""View details" by clicking on the button, a list of employees and the date of the last activity that falls within the period you specified opens. This list can be downloaded by clicking the "Export" button.
"Reset Filters" allows you to reset the filters you set in this widget.
2. Average score on the program test
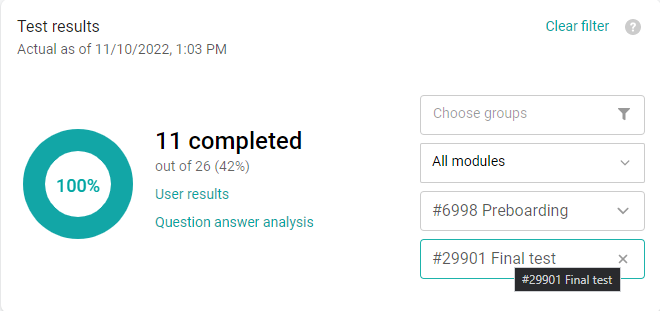
The average result of passing tests (from training programs) by employees.
For example, 3 employees passed the test by 60%, 2 passed by 100%, we get (3*60%+2*100%)/5 = 76%.
The chart shows the average result of passing the test from the number of users who successfully completed the test – the status "Passed".
Tests with the status "Under review" are not considered completed, since the result is not yet known for them.
The number is calculated only for those users who currently have access to the test.
That is, if the user passed the test, but then lost access to it, he will not be taken into account in this statistics.
Filters:
By groups
By sections
By programs
According to the tests.
Filters by sections, programs, and tests are related to each other. If something is selected in the section filter, then only programs from this section will be displayed in the program filter. A similar relationship between the filter by programs and the filter by tests.
If you change the value in the filter by section, the filters by programs and tests will be reset. Similarly, if you change the value in the program filter, the test filter will be reset.
"User results" – go to the details of the report,
"Analysis of answers to questions" – go to the report with a list of questions of the selected test.
Reports can be uploaded by clicking "Export".
3. The average result of the programs.
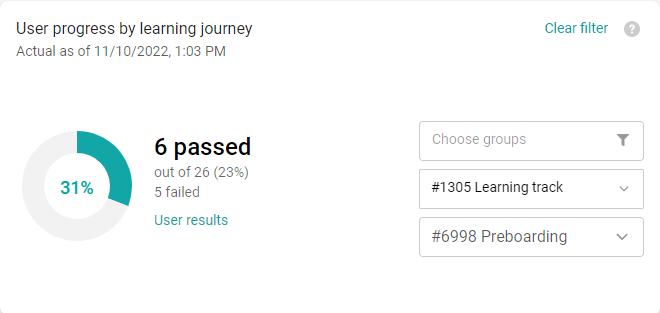
The widget displays the average result of the selected program. For example, 2 employees completed the program by 60%, 1 employee passed by 100%, 2 employees did not start. Then: (2*60%+1*100%+2*0%)/5 = 44%",
Diagram area (until the admin has selected something in the program filter, a hint is displayed about the need to select a program):
The number of users to whom this program is assigned (depends on administrator access and group filter).
The number of users assigned to this program who have the status "Not passed" (depends on administrator access and filter by groups)..
The number of users assigned to this program who have the status "Passed" (depends on administrator access and filter by groups)..
The average progress of the program as a percentage is shown on the chart.
"User results" – go to the details of the report. The user report shows a list of users and their progress on this program.
The report can be uploaded by clicking "Export".
Filters:
By groups
By sections
By the name of the program.
Filters by sections and programs are related to each other. If something is selected in the section filter, then only programs from this section will be displayed in the program filter.
If you change the value in the filter by section, the filter by programs will be reset.
4. Event statistics.

The widget "Average attendance of events" shows events for the period, their attendance and statuses.
For example, if an event is available to 100 users, and 20 took part, then the attendance is 20%.
Failed events are not included in the calculation. The widget's information block shows the average number of accesses/records/presences per event.
It is possible to select groups of employees in the filters and set a period (week, month, quarter, all the time).
"View details" – go to the details of the report. The report can be uploaded by clicking "Export".
"Mandatory only" is enabled by default, you can disable it if necessary.
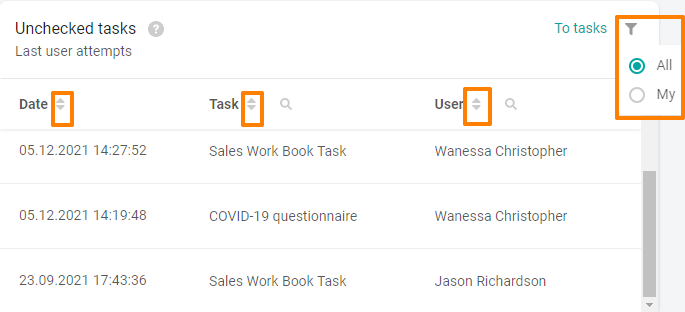
5. Unchecked tasks.
The widget displays the last submitted tasks of users that the administrator has not yet checked.
Filters:
All - displays all tasks available for review.
My - the functionality of this filter is under development. It will display all the tasks available for review, where the administrator is the reviewer.
You can also sort the data:
1) Sorting by dates - descending (from new to old).
It is possible to sort in reverse (by clicking on the arrow) - from old to new.
2) Tasks - sort alphabetically by clicking on the arrow.
3) The user - by clicking on the arrow sorts alphabetically.
By clicking on a line from the widget, you go to the selected task, to the "Check" sheet.
By clicking on the "To tasks" button, the transition to all tasks is carried out.
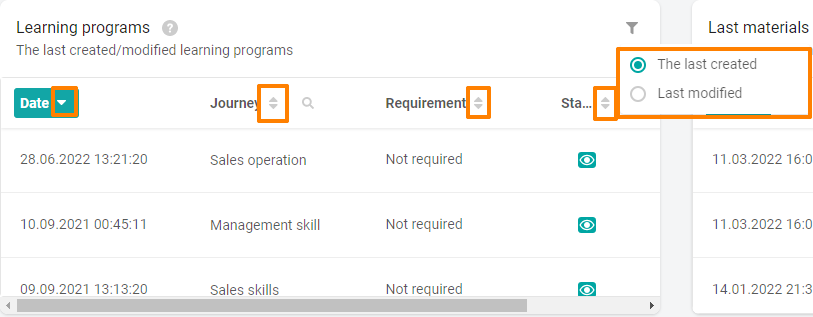
6. Learning programs.
The widget displays the 8 latest training programs.
Depending on the "Filter" switch, the last added or modified programs are displayed in the list.
Programs are displayed regardless of the module name and the availability of additional modules.
Filters:
Last created - 8 last created programs.
Last modified - 8 last modified programs.
Sorting data:
1) Sorting by dates - descending (from new to old).
2) The program - by clicking on the arrow sorts alphabetically.
3) Sorting by mandatory and optional.
4) Status - sort alphabetically (active, hidden)
5) Section - sorts alphabetically.
You can also search by clicking on the magnifying glass.

When you click on the line with the data, you switch to the selected learning program.
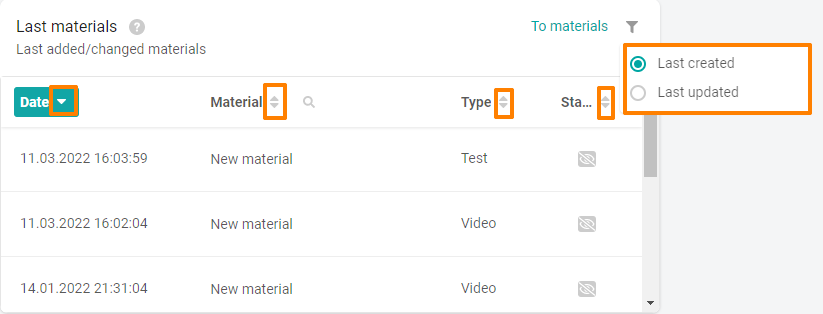
7. Latest materials.
The widget displays the 8 latest materials from the "Materials" section
Depending on the "Filter" switch, the last added or changed materials are displayed in the list.
Filters:
Last created - 8 last created materials.
Last modified - 8 last modified materials.
Sorting data:
1) Sorting by dates - descending (from new to old).
2) Material - sorts alphabetically by clicking on the arrow.
3) Type - the type of material is displayed
4) Status - sort alphabetically (active, hidden)
You can also search by clicking on the magnifying glass.

To go to the material, select a line in the list with the mouse.
To go to all the materials in the section, click the "To materials" button.